
Monitor your cluster
InfluxData provides a Grafana operational dashboard that provides observability into your InfluxDB Cloud Dedicated cluster. Use the operational dashboard to monitor your cluster.
Not available for all clusters
InfluxDB Cloud Dedicated operational dashboards are not available for all clusters. For questions about availability, contact InfluxData support.
Access your operational dashboard
To access your InfluxDB Cloud Dedicated operational dashboard, visit the
/observability endpoint of your InfluxDB Cloud Dedicated cluster in your browser:
https://cluster-id.a.influxdb.io/observability
Use the credentials provided by InfluxData to log into your cluster operational dashboard. If you do not have login credentials, contact InfluxData support.
Dashboard sections and cells
The dashboard contains the following sections that visualize metrics related to the health of components in your InfluxDB Cloud Dedicated cluster:
- Query Tier Cpu/Mem
- Query Tier
- Ingest Tier Cpu/Mem
- Ingest Tier
- Compaction Tier Cpu/Mem
- Compactor
- Ingestor Catalog Operations
- Catalog Operations Overview
Query Tier Cpu/Mem
The Query Tier Cpu/Mem section displays the CPU and memory usage of query pods as reported by Kubernetes. Queriers handle query requests and returns query results for requests.
CPU Utilization (k8s)
The CPU utilization of query pods as reported by the Kubernetes container usage. Usage is reported by the number of CPU cores used by pods, including fractional cores. The CPU limit is represented by the top line in the visualization.
Memory Usage (k8s)
The memory usage of the query pod containers per cgroup as reported by Kubernetes. Usage is reported in a magnitude of bytes. The memory limit is represented by the top line in the visualization.
Query Tier
The Query Tier section displays metrics reported from the InfluxDB gRPC query API. Queriers handle query requests and returns query results for requests.
- gRPC Requests (ok)
- gRPC Requests (not ok)
- Request Duration (flight DoGet) (ok + !ok)
- Successful Request Duration (flight DoGet)
- Acquire Duration
gRPC Requests (ok)
The rate of gRPC requests for different endpoints that returned the OK status code,
summed across all queriers.
Request rate is reported in requests per second.
gRPC Requests (not ok)
The rate of gRPC requests for all endpoints that returned a status code other
than OK, summed across all queriers.
Request rate is reported in requests per second.
Request Duration (flight DoGet) (ok + !ok)
A gRPC request duration heatmap for all requests to the DoGet endpoint
regardless of request status.
The heatmap shows how many requests occurred in each duration “bucket” per time interval and provides insight into how long a typical query request takes. It also shows, at a glance, the predominate latency range as well as the minimum and maximum durations of all query requests.
The color scheme is a indicator of the value of each cell relative to the currently displayed data.
Successful Request Duration (flight DoGet)
A gRPC request duration heatmap for successful requests to the DoGet endpoint.
The heatmap shows how many requests occurred in each duration “bucket” per time interval and provides insight into how long a typical successful query request takes. It also shows, at a glance, the predominate latency range as well as the minimum and maximum durations of successful query requests.
The color scheme is a indicator of the value of each cell relative to the currently displayed data.
Acquire Duration
A heatmap of how long a query waits to pass the query semaphore–a mechanism that limits the number of concurrent query requests that can be processed and protects against Out of Memory (OOM) errors that can be caused by unaccounted-for data structures that may occur during query planning and execution. This cell only provides information about the queries waiting for the semaphore, not the time holding it.
This cell can be used to gauge how much query latency is added due to a high cluster load.
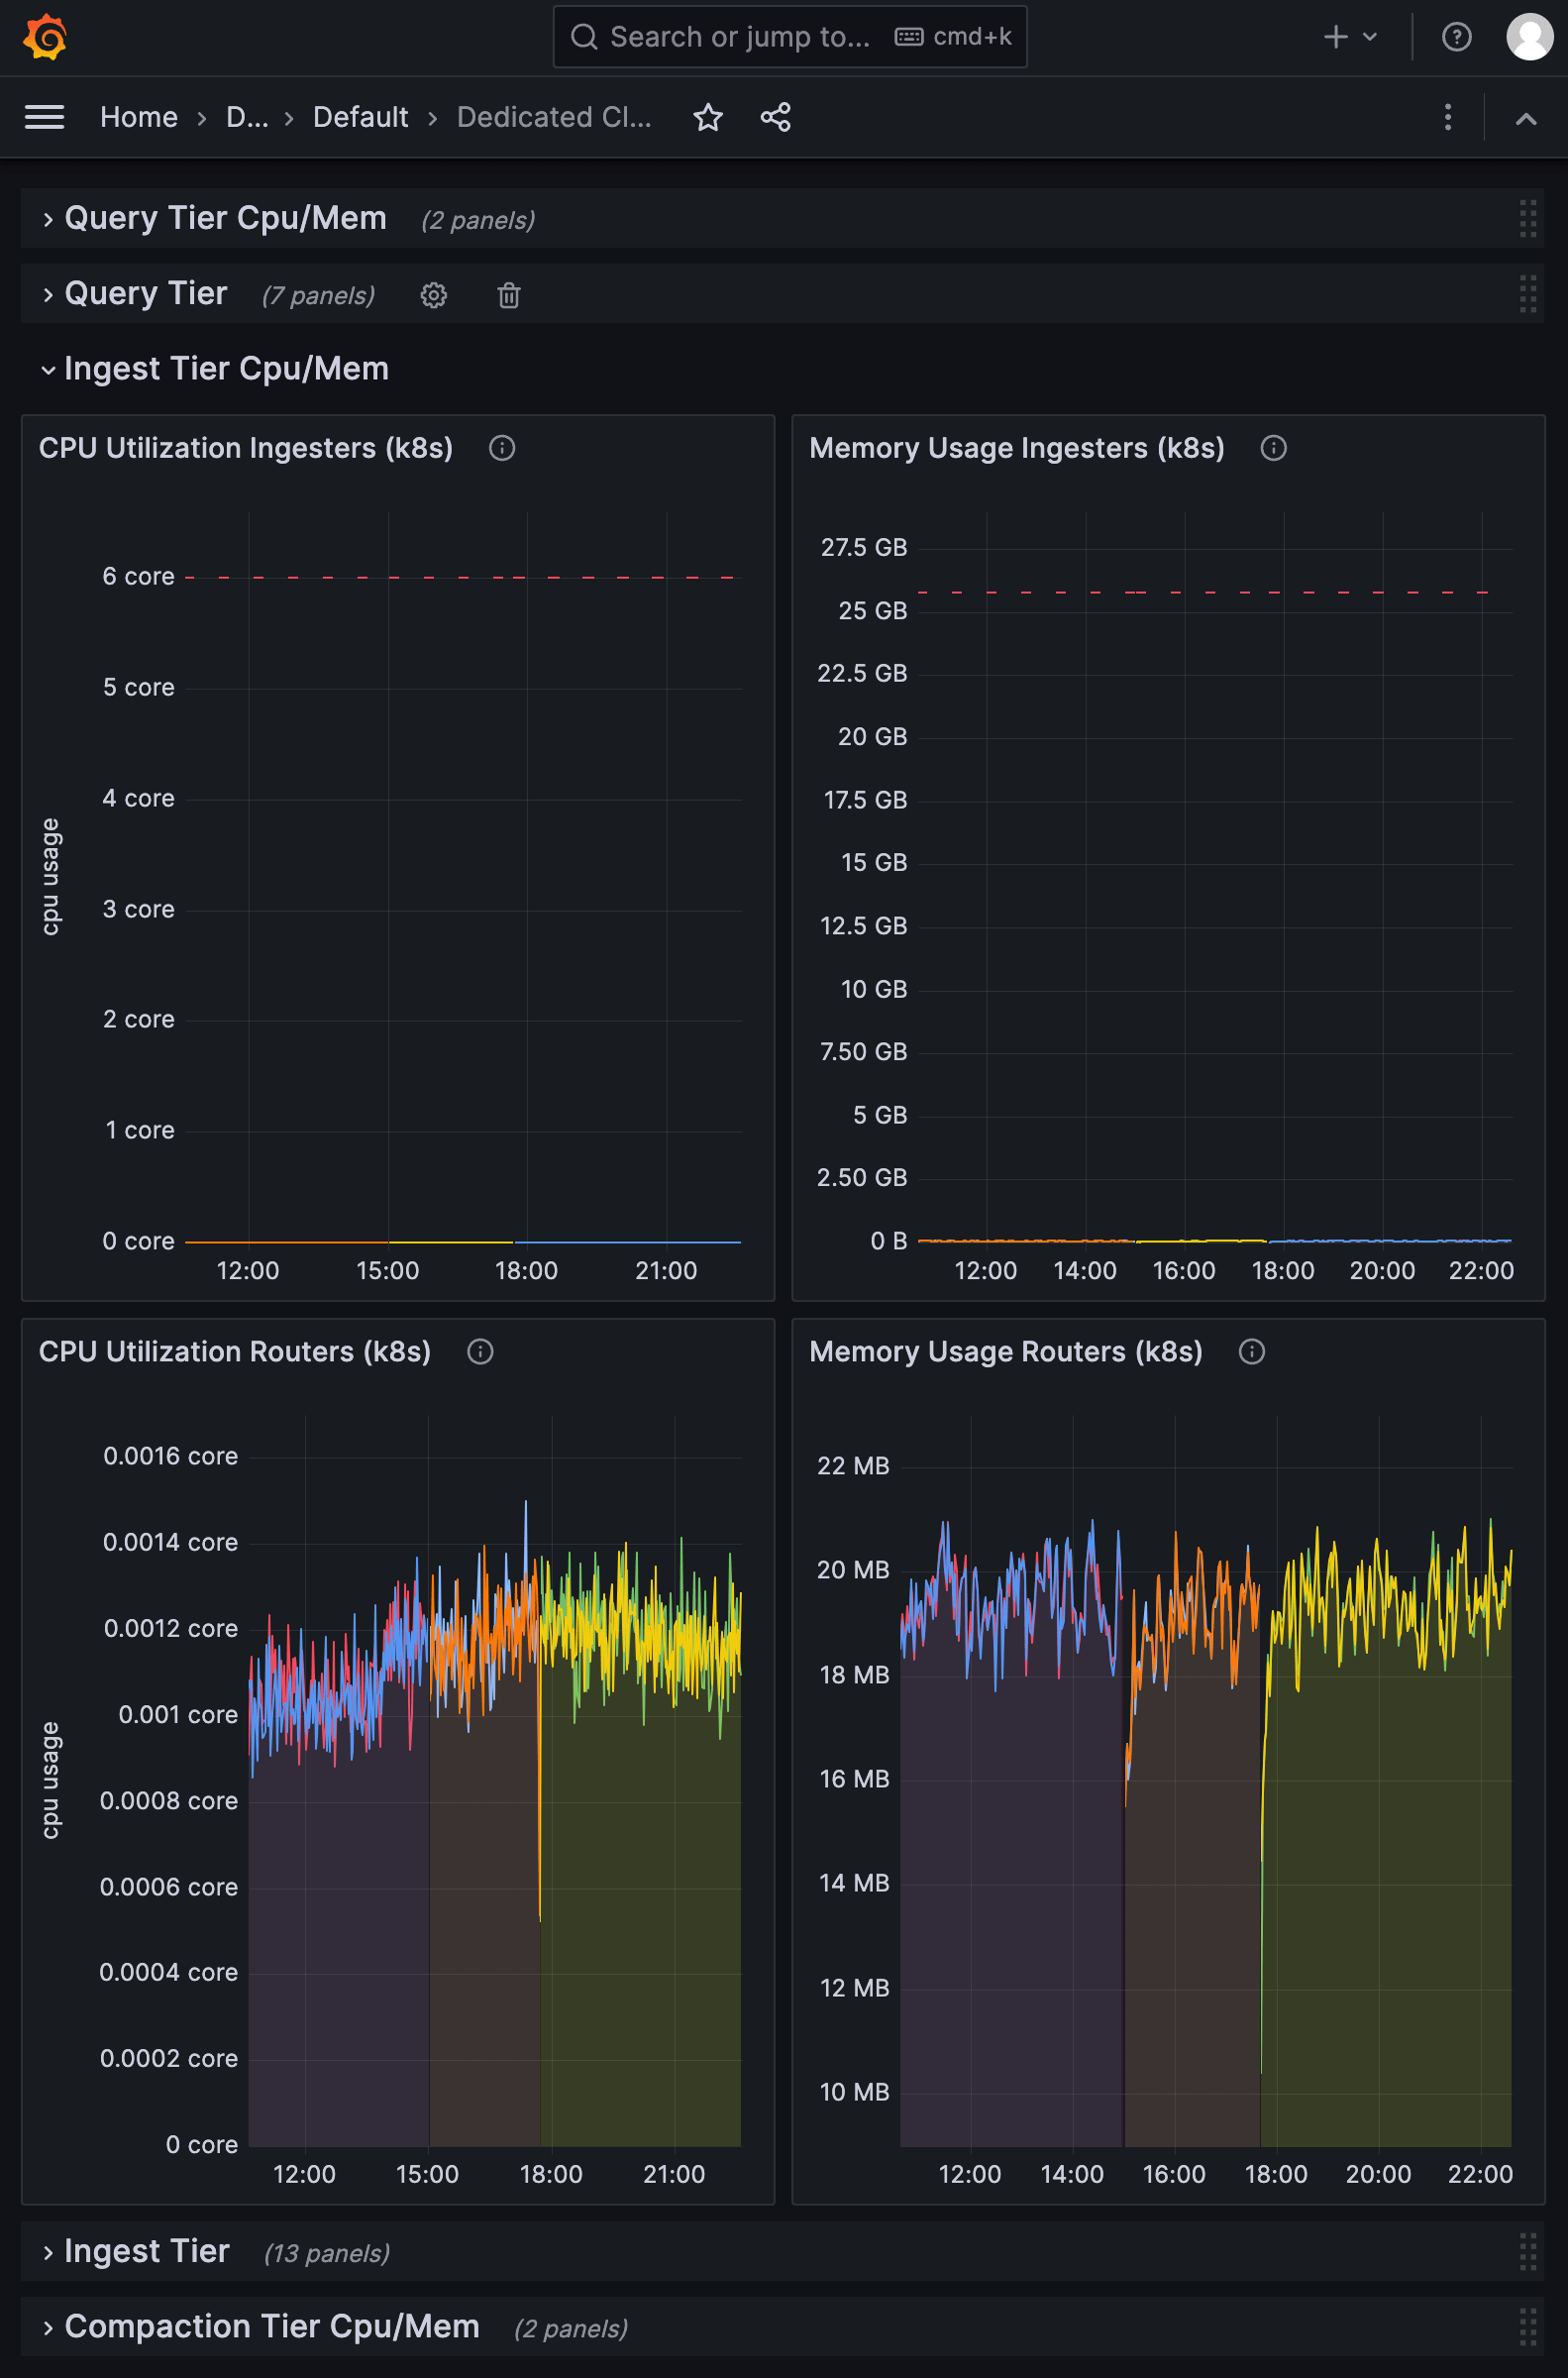
Ingest Tier Cpu/Mem
The Query Tier Cpu/Mem section displays the CPU and memory usage of Ingester pods as reported by Kubernetes. Ingesters process line protocol submitted in write requests and persist time series data to the Object store.
- CPU Utilization Ingesters (k8s)
- Memory Usage Ingesters (k8s)
- CPU Utilization Routers (k8s)
- Memory Usage Routers (k8s)
CPU Utilization Ingesters (k8s)
CPU utilization of Ingester pods as reported by the Kubernetes container usage. Usage is reported by the number of CPU cores used by pods, including fractional cores. The CPU limit is represented by the top line in the visualization.
Memory Usage Ingesters (k8s)
Memory usage of the Ingester pod containers per cgroup as reported by Kubernetes. Usage is reported in a magnitude of bytes. The memory limit is represented by the top line in the visualization.
CPU Utilization Routers (k8s)
CPU utilization of Ingester router pods as reported by the Kubernetes container usage. Usage is reported by the number of CPU cores used by pods, including fractional cores.
Memory Usage Routers (k8s)
Memory usage of the Ingester router pod containers per cgroup as reported by Kubernetes. Usage is reported in a magnitude of bytes.
Ingest Tier
The Ingest Tier section displays metrics reported from the InfluxDB gRPC and HTTP write APIs. Ingesters process line protocol submitted in write requests and persist time series data to the Object store.
- Write Requests (at router)
- LP Ingest (at router) (lines)
- LP Ingest (at router) (bytes)
- HTTP request error rate (server’s POV at Router)
- Healthy Upstream Ingesters per Router
- Persist Queue Depth
- Persist Task Queue Duration
- Ingester Disk Data Directory Usage
- Ingest Blocked Time (24h)
- Max Persist Queue Depth
- Write Logs (10 examples)
Write Requests (at router)
Number of write operations completed across all Ingester routers. Requests are grouped by state (success or error). Request rate is reported in requests per second.
LP Ingest (at router)
Rate of lines of line protocol being received by each router and across all Ingester routers. Request rate is reported in lines per second.
LP Ingest (at router)
Rate of bytes of line protocol being received by each router and across all Ingester routers. Request rate is reported in bytes per second.
HTTP request error rate (server’s POV at Router)
HTTP request error rate reported by the InfluxDB v3 HTTP request handler. Error rate is represented the percentage in total requests that return a non-2xx response code.
Healthy Upstream Ingesters per Router
The number of healthy upstream Ingesters each router detects. This reflects the router’s RPC request balancer or circuit breaker state.
This can indicate when routers can’t connect to Ingesters becaåuse of because of issues in the ingest pipeline such as network issues or Ingester availability.
The Persist Queue is the queue for persisting, or saving to s3, new parquey files.
Persist Queue Depth
The number of queued persist jobs that have not started. Each persist jobs consists of taking data from the Write Ahead Log (WAL), storing it in a Parquet file, and saving the Parquet file to the Object store.
If the persist queue is growing it means Ingesters are not keeping up with the incoming write load and may result in Ingester failure.
Persist Task Queue Duration
A heatmap that shows the time persist jobs spend in the queue before being executed.
Longer queue times indicate slower persist job execution times which may be due to network or internal resource constraints, or an increasing queue depth.
Ingester Disk Data Directory Usage
The per-pod disk usage as a percentage of the Ingesters’ data directory. The WAL is stored on a disk attached to the Ingesters. As the WAL grows, more disk space is used. If Ingesters run out of disk, the WAL stops functioning.
Ingest Blocked Time (24h)
The amount of time the ingest pipeline has been marked as saturated and rejected write requests.
Max Persist Queue Depth
The queue depth as a percentage of the configured maximum queue depth. This shows the saturation level of the most saturated Ingester. Once the maximum queue depth is reached, writes are rejected.
Write Logs (10 examples)
A sample of 10 write logs from the displayed time period. These do not represent the most recent logs.
Compaction Tier Cpu/Mem
The Compaction Tier Cpu/Mem section displays the CPU and memory usage of Compactor pods as reported by Kubernetes. Compactors process and compress Parquet files in the Object store to continually optimize storage.
CPU Utilization (k8s)
The CPU utilization of compactor pods as reported by the Kubernetes container usage. Usage is reported by the number of CPU cores used by pods, including fractional cores. The CPU limit is represented by the top line in the visualization.
Memory Usage (k8s)
The memory usage of compactor pod containers per cgroup as reported by Kubernetes. Usage is reported in a magnitude of bytes. The memory limit is represented by the top line in the visualization.
Compactor
The Compactor section displays metrics related to the compaction of Parquet files in the Object store. Compactors process and compress Parquet files to continually optimize storage.
Compactor: L0 File Counts (5m bucket width)
A histogram of the quantity of L0-compacted files at time of compaction.
Ingesters create Parquet files using L0 (level zero) compaction. As Compactors process and compact Parquet files over time, they do so in the following levels:
- L0: Uncompacted
- L1: 4 L0 files compacted together
- L2: 4 L1 files compacted together
- L3: 4 L2 files compacted together
Parquet files store data partitioned by time and optionally tags (see Manage data partition). After four L0 files accumulate for a partition, they’re eligible for compaction. If the compactor is keeping up with the incoming write load, all compaction events have exactly four files. An increase in the number of L0 files compacted indicates the compactor isn’t keeping up.
This histogram helps to determine if the Compactor is starting compactions as soon as it can.
Ingestor Catalog Operations
The Ingestor Catalog Operations section displays metrics related to Catalog operations requested by Ingesters. The Catalog is a relational database that stores metadata related to your time series data including schema information and physical locations of partitions in the Object store.
Catalog Ops - success
The rate of successful Catalog operations per second requested by Ingesters. Higher rates of successful Catalog operations requested by Ingesters indicate a high write load.
Catalog Ops - error
The rate of erred catalog operations per second requested by Ingesters. Higher rates of erred Catalog operations requested by Ingesters indicate that the Catalog may be overloaded or unresponsive.
Catalog Op Latency (P90)
The 90th percentile (P90) query latency for each operation against the catalog service. A high P90 value indicates that the Catalog may be overloaded.
Catalog Operations Overview
The Catalog Operations Overview section displays metrics related to Catalog operations requested by all components of your InfluxDB Cloud Dedicated cluster.
Requests per Operation - success
The rate of successful Catalog requests per second by operation.
Requests per Operation - error
The rate of erred Catalog requests per second by operation. Higher rates of erred Catalog operations indicate that the Catalog may be overloaded or unresponsive.
Was this page helpful?
Thank you for your feedback!
Support and feedback
Thank you for being part of our community! We welcome and encourage your feedback and bug reports for InfluxDB and this documentation. To find support, use the following resources:
Customers with an annual or support contract can contact InfluxData Support.