
Using Kapacitor in Chronograf
Contents
Overview
As a part of the TICK stack, Chronograf is a graphical user interface designed to simplify monitoring infrastructure, visualizing data, administering databases and managing alerts. It is through alert management that Chronograf gets integrated with Kapacitor.
In the Chronograf documentation, working with Kapacitor is covered in the sections Connecting Chronograf to Kapacitor, Create a Kapacitor Alert, Configure Kapacitor Event Handlers, and Advanced Kapacitor Usage.
This current document will summarize many of the points presented there and provide tips for working with tasks and TICKscripts in Chronograf.
Configuring Chronograf to work with Kapacitor
Kapacitor instances in Chronograf are associated with specific InfluxDB databases which should already be bound to both Kapacitor and Chronograf. To define an InfluxDB database in Kapacitor, see Getting started with Kapacitor or the Configuring Kapacitor guides. To define an InfluxDB database in Chronograf, see InfluxDB setup in the Chronograf documentation.
Add a Kapacitor instance
To add a Kapacitor instance to Chronograf:
In the left navigation bar click the Configuration cog-wheel icon. A list of InfluxDB sources is loaded.

Locate the InfluxDB source in the list and in the right most column under the “Active Kapacitor” heading, click Add Config. The Configure Kapacitor page loads with default settings.

In the grouping “Connection Details” set the values for Kapacitor URL and a Name for this Kapacitor, also add username and password credentials if necessary.
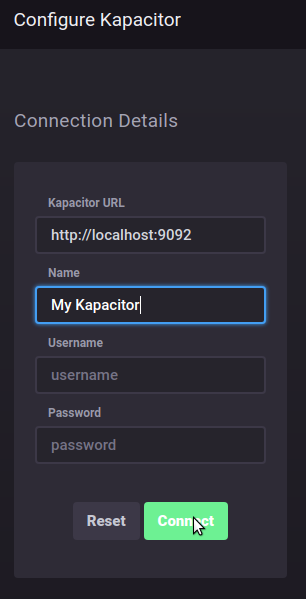
Click the Connect button. If the “Connection Details” are correct a success message is displayed and a new section will appear “Configure Alert Endpoints”.

If a third party alert service or SMTP is used, update, the third party settings in the “Configure Alert Endpoints” section.
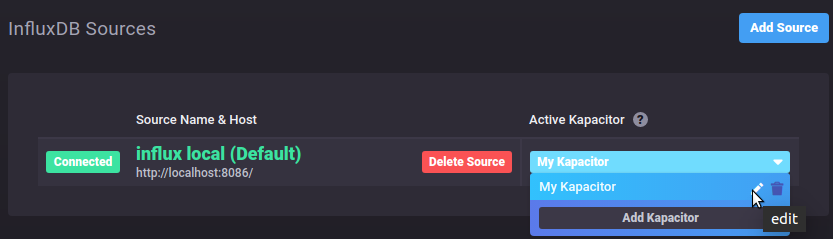
Return to the “Configuration” page by clicking on the Configuration icon once more. The new Kapacitor instance should be listed under the “Active Kapacitor” heading.

Managing Kapacitor from Chronograf
Event Handlers
One of key set of Kapacitor features that can be modified through Chronograf are third party alert handlers.
To modify a third party alert handler:
In the Configuration table locate the Influxdata instance and its associated Kapacitor instance, click the Kapacitor drop down menu and then the edit icon.
Click on the handler that needs to be changed. Its tab will become active.

Edit the relevant fields and click the Update Config button.

If the configuration properties are valid a success message will appear.

The updated configuration can be verified over the Kapacitor HTTP API. For example, to verify an updated SMTP configuration check the JSON document at the endpoint
/kapacitor/v1/config/smtp(for example:http://localhost:9092/kapacitor/v1/config/smtp).
For more information see the section, Configure with the HTTP API.
Creating Alerts in Chronograf
Alerts in Chronograf correspond to Kapacitor tasks designed specifically to trigger alerts whenever the data stream values rise above or fall below designated thresholds. Please note that only the most common alerting use cases are manageable through Chronograf. These include:
- Thresholds with static ceilings, floors and ranges.
- Relative thresholds based on unit or percentage changes.
- Deadman switches.
More refined alerts and other tasks need to be defined directly in Kapacitor.
To create a basic static threshold alert based on the CPU measurements provided by Telegraf:
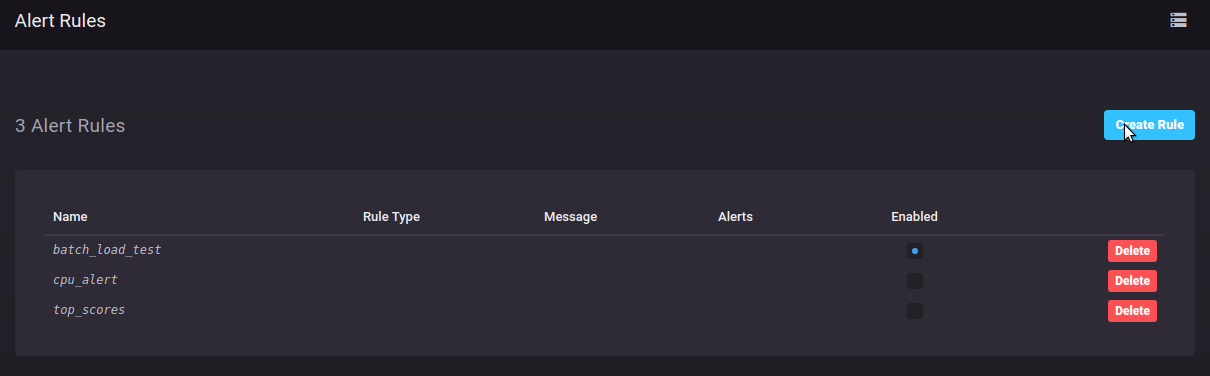
Open the Alert rules tab by clicking on the Alerting icon in the left navigation bar and then on Create in the pop up menu. A table of alert rules (Kapacitor tasks) will load. These are queried from Kapacitor.

Click on the Create Rule button. The Create/Edit rule page will load.
Notice in the top left the rule name edit box with the string Untitled Rule. Change this name to something sensible for the alert to be created.
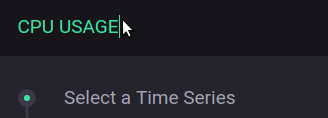
In the section Select a Time Series, select a database, a measurement and a field to be monitored. Note that in the measurement one or more tags can be selected. However, selecting specific tags is not required. Note as well that alongside each tag it is possible to select the tag for a group by clause.

In the section Rule Conditions, for this example, keep the tag Thresholds selected. In the drop down list box for the is clause, select less than. And, in the edit box for the quantity enter the value 80, which for this field means percent.

In the section Alert Message keep the tab smtp. Note that this requires the SMTP handler to be correctly configured. Update the values for the addressees and the message body. Note as well that the bottom or template text area accepts the template fields suggested just below it. Click on a template field to add it to the template.

When the three key sections are correctly configured click the Save Rule button. The rule list will load once again.

The new rule is visible in the list. It can be opened for editing by clicking on its name.
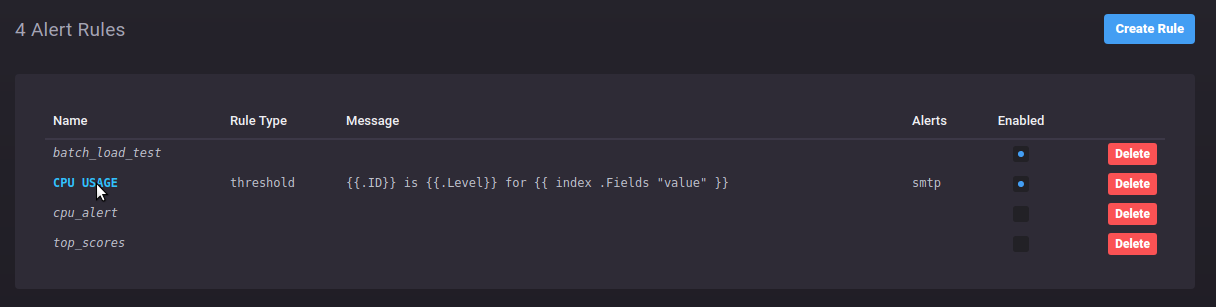
The rule is also visible through the Kapacitor command line client.
Example 1 – Viewing a Chronograf Alert in Kapacitor
$ kapacitor list tasks
ID                                                 Type      Status    Executing Databases and Retention Policies
batch_load_test                                    batch     enabled   true      ["telegraf"."autogen"]
chronograf-v1-b12b2554-cf38-4d7e-af24-5b0cd3cecc54 stream    enabled   true      ["telegraf"."autogen"]
cpu_alert                                          stream    disabled  false     ["telegraf"."autogen"]
top_scores                                         stream    disabled  false     ["game"."autogen"]
Tasks (or Alert Rules) generated by Chronograf are listed with the chronograf
and version tokens (e.g. v1) followed by a UUID.
Managing Tasks through Chronograf
Through Chronograf Kapacitor tasks can be enabled, disabled and deleted. This applies even to tasks that were not generated as Chronograf alerts.
To enable a task through Chronograf:
- Locate the task in the Alert Rules table.
- In the column Enabled toggle the state of the task from disabled to enabled . A message indicating the change of state will appear at the top of the page.

The change of state can also be verified on the Kapacitor side by listing the tasks with the command line client and checking the Status column.
Example 2 – Viewing a task enabled through Chronograf in Kapacitor
$ kapacitor list tasks
ID                                                 Type      Status    Executing Databases and Retention Policies
batch_load_test                                    batch     enabled   true      ["telegraf"."autogen"]
chronograf-v1-b12b2554-cf38-4d7e-af24-5b0cd3cecc54 stream    enabled   true      ["telegraf"."autogen"]
chronograf-v1-fa28d99e-e875-4521-8bd2-463807522bbd stream    enabled   true      ["co2accumulator"."autogen"]
cpu_alert                                          stream    disabled  false     ["telegraf"."autogen"]
top_scores                                         stream    disabled  false     ["game"."autogen"]
To disable a task through Chronograf:
- Locate the task in the Alert Rules table. See the screenshot above.
- In the column Enabled toggle the state of the task from enabled to disabled . A message indicating the change of state will appear at the top of the page.
The change of state can also be verified on the Kapacitor side by listing the tasks with the command line client and checking the Status column.
Example 3 – Viewing a task disabled through Chronograf in Kapacitor
$ kapacitor list tasks
ID                                                 Type      Status    Executing Databases and Retention Policies
batch_load_test                                    batch     enabled   true      ["telegraf"."autogen"]
chronograf-v1-b12b2554-cf38-4d7e-af24-5b0cd3cecc54 stream    enabled   true      ["telegraf"."autogen"]
chronograf-v1-fa28d99e-e875-4521-8bd2-463807522bbd stream    disabled  false     ["co2accumulator"."autogen"]
cpu_alert                                          stream    disabled  false     ["telegraf"."autogen"]
top_scores
To delete a task through Chronograf:
- Locate the task in the Alert Rules table.
- Click on the Delete button in the final column of the table. A message indicating that the task was deleted will appear at the top of the page.

The deletion can also be verified on the Kapacitor side by listing the tasks with the command line client.
Example 4 – Verification of a task deleted through Chronograf
$ kapacitor list tasks
ID                                                 Type      Status    Executing Databases and Retention Policies
batch_load_test                                    batch     enabled   true      ["telegraf"."autogen"]
chronograf-v1-b12b2554-cf38-4d7e-af24-5b0cd3cecc54 stream    enabled   true      ["telegraf"."autogen"]
cpu_alert                                          stream    disabled  false     ["telegraf"."autogen"]
top_scores                                         stream    disabled  false     ["game"."autogen"]
Note: Please remember that all Kapacitor tasks are accessible through Chronograf. When disabling, enabling and deleting tasks with Chronograf, attention should be paid to not change inadvertently the state or existence of a task not associated with Chronograf alerts.
Viewing Alert tasks in Chronograf
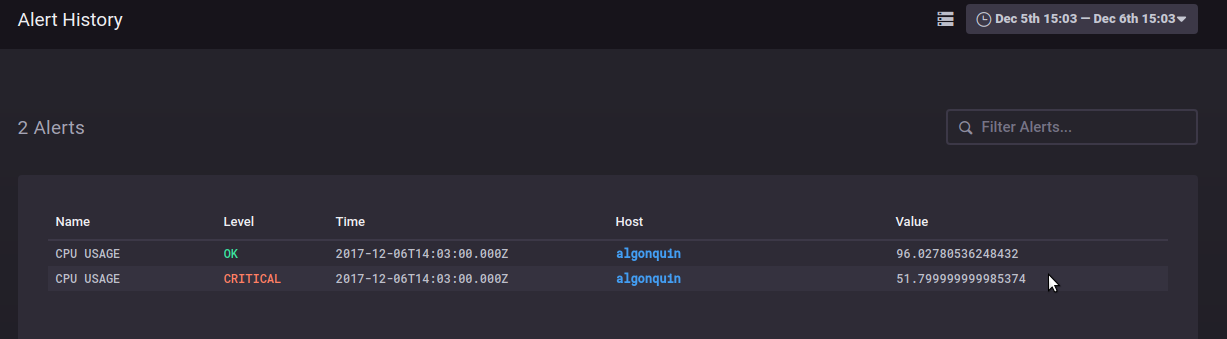
Chronograf Alerts are made visible in the Alert History page.
To view the page.
Click on the Alerts Icon in the left navigation bar. A menu will pop up.
In the pop-up menu select the item History.

The Alert History page will load with a table showing the alerts posted within the time frame defined by the drop-down filter in the top right corner of the page.
Kapacitor Tasks and Chronograf
When first writing with TICKscripts and working with Kapacitor tasks, inspecting tasks generated by Chronograf can be instructive.
To view a generated task open it with the kapacitor client show command.
Example 5 – Showing a Chronograf Alert task in Kapacitor
$ kapacitor show chronograf-v1-b12b2554-cf38-4d7e-af24-5b0cd3cecc54
ID: chronograf-v1-b12b2554-cf38-4d7e-af24-5b0cd3cecc54
Error:
Template:
Type: stream
Status: enabled
Executing: true
The console output includes a TICKscript section showing the script used to create the task.
Example 6 – The TICKscript of a Chronograf Alert task
// ...
var db = 'telegraf'

var rp = 'autogen'

var measurement = 'cpu'

var groupBy = []

var whereFilter = lambda: TRUE

var name = 'CPU USAGE'

var idVar = name + ':{{.Group}}'

var message = ' {{.ID}} is {{.Level}} for {{ index .Fields "value" }}'

var idTag = 'alertID'

var levelTag = 'level'

var messageField = 'message'

var durationField = 'duration'

var outputDB = 'chronograf'

var outputRP = 'autogen'

var outputMeasurement = 'alerts'

var triggerType = 'threshold'

var details = 'CPU usage is up. '

var crit = 80

var data = stream
    |from()
        .database(db)
        .retentionPolicy(rp)
        .measurement(measurement)
        .groupBy(groupBy)
        .where(whereFilter)
    |eval(lambda: "usage_idle")
        .as('value')

var trigger = data
    |alert()
        .crit(lambda: "value" < crit)
        .stateChangesOnly()
        .message(message)
        .id(idVar)
        .idTag(idTag)
        .levelTag(levelTag)
        .messageField(messageField)
        .durationField(durationField)
        .details(details)
        .email('heinrich.faust@1808.io', 'valentin.faust@1808.io')

trigger
    |influxDBOut()
        .create()
        .database(outputDB)
        .retentionPolicy(outputRP)
        .measurement(outputMeasurement)
        .tag('alertName', name)
        .tag('triggerType', triggerType)

trigger
    |httpOut('output')
// ...
Note that all values not generated by method calls are defined as variables
before they are used in method calls. Furthermore the pipeline is broken up
into four parts, two of which result in a variable assignment. The variable
trigger is of special interest. It takes the alert stream and then first
writes it to the chronograf database’s alerts measurement before additionally
caching it to an endpoint of Kapacitor’s HTTP server.
Viewing Alerts from Tasks in the Alert History of Chronograf
Kapacitor tasks that generate alerts do not have to be defined in Chronograf in
order for those alerts to appear in Chronograf’s Alert History. They
simply need to write alert data to the alerts measurement of the chronograf
database in InfluxDB.
For example an alert based on CPU usage in Telegraf can be written similar to
the Chronograf generated alert shown above. The name can be changed and the
fields in the property methods of the InfluxDBOut() chaining method can be
defined using literal values.
Example 7 – influxDBOut configured for Chronograf Alert History
// ...
var name = 'CPU ALERTS FROM FUBAR'
// ...
var trigger = data
    |alert()
// ...
trigger
    |influxDBOut()
        .create()
        .database('chronograf')
        .retentionPolicy('autogen')
        .measurement('alerts')
        .tag('alertName', name)
        .tag('triggerType', 'custom')
/// ...
A TICKscript with this trigger block can be defined as follows.
$ kapacitor define cpu_alert_fubar -tick cpu_chron_alert.tick -type stream -dbrp "telegraf"."autogen"It will then be visible in Chronograf alerts.

Enable it and then add an artificial load to the CPU.
while true; do i=0; doneAfter a few minutes the alert will appear in the Alert History table of Chronograf.

In order for the alert to be visible in Chronograf, it is important to add the
tag with the key value alertName to the datapoints written by
influxDBOut() as well as the tag with the key value triggerType.
Writing a Task to be editable in Chronograf
For a task to be editable in Chronograf it needs to contain the variables
generated by a Chronograph alert task. These variables are visible in
Example 6. The task should also be a simple alert task like those
generated by Chronograf. By including the variables and the chaining method
infludDBOut() the task will then be accessible through a link in the
Chronograf Alert Rules table.

By clicking through the link the Edit Alert page will load with the task.å

Summary
This document presented the essentials of adding a Kapacitor Instance to
Chronograf and then using that instance to create, enable, edit, disable and
delete alert tasks. The alerts generated by Chronograf are written as tasks
directly to the Kapacitor instance, where they can be listed, reviewed and
managed further using the kapacitor command line client application.
Also presented was how to enable Kapacitor tasks to write alerts to the
chronograf database in InfluxDB, so that they will be visible in the
Alert History of Chronograf. By adding Chronograf variables to a simple
alert TICKscript, the task will be editable in Chronograf.
Was this page helpful?
Thank you for your feedback!
Support and feedback
Thank you for being part of our community! We welcome and encourage your feedback and bug reports for Kapacitor and this documentation. To find support, use the following resources: